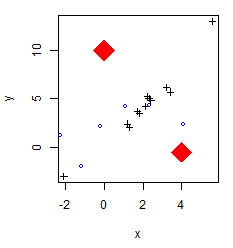
points(x, y, ...)
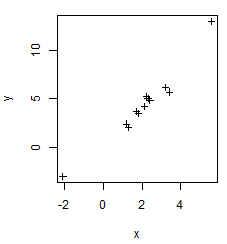
First let's make a scatter plot:
>x <- c(1.2,3.4,1.3,-2.1,5.6,2.3,3.2,2.4,2.1,1.8,1.7,2.2)
>y <- c(2.4,5.7,2.0,-3,13,5,6.2,4.8,4.2,3.5,3.7,5.2)
>plot(x,y,cex=.8,pch=1,xlab="x",ylab="y",col="black")
Add some points to the plot:
>x2 <- c(4.1,1.1,-2.3,-0.2,-1.2,2.3)
>y2 <- c(2.3,4.2,1.2,2.1,-2,4.3)
>points(x2,y2,cex=.8,pch=3,col="blue")
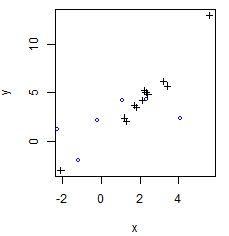
Notice that there is a point almost out of the left border. If the added points are out of the plot border,
they were not be added to the plot. In the example above, the smallest value of x is -2.1, and largest is
5.6, the y value range is -3 < y < 13, so the added points should be inside that range.
The
>x3 <- c(0,4)
>y3 <- c(10,-0.5)
>points(x3,y3,cex=4,pch=18,col="red")