abline() function adds a line to plot. It's expression is:
abline(a = NULL, b = NULL, h = NULL, v = NULL, reg = NULL,
coef = NULL, untf = FALSE, ...)
lines(x, y = NULL, type = "l", ...)
a,b: intercept and slope
h: for horizontal line
v: for vertical line
x, y: coordinate vectors of points to join
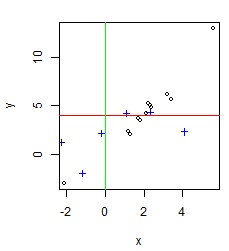
First let's make a plot:
>x <- c(1.2,3.4,1.3,-2.1,5.6,2.3,3.2,2.4,2.1,1.8,1.7,2.2)
>y <- c(2.4,5.7,2.0,-3,13,5,6.2,4.8,4.2,3.5,3.7,5.2)
>plot(x,y,cex=.8,pch=1,xlab="x",ylab="y",col="black")
>x2 <- c(4.1,1.1,-2.3,-0.2,-1.2,2.3)
>y2 <- c(2.3,4.2,1.2,2.1,-2,4.3)
>points(x2,y2,cex=.8,pch=3,col="blue")

Let's add a red horizontal line at y=4 to the plot:
>abline(h=4,col="red")

Let's add a green vertical line at x=0 to the plot:
>abline(v=0,col="green")
Let's add a blue line with intercept 2 and slope 2 to the plot:
>abline(a=2,b=2,col="blue")
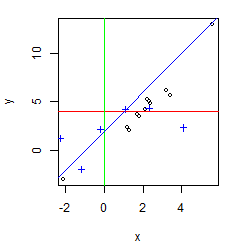
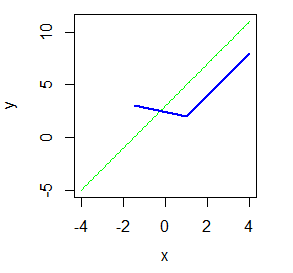
> curve(2 * x + 3, -4, 4, col="green", ylab="y")
> lines(x2,y2,col="blue", lwd=2)
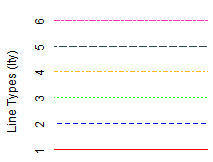
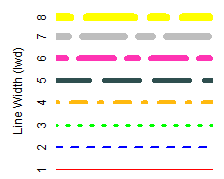
lty= and lwd= control the line type and line width.
There are 6 line types: