legend(x, y = NULL, legend, fill = NULL, col = par("col"),
border = "black", lty, lwd, pch,
angle = 45, density = NULL, bty = "o", bg = par("bg"),
box.lwd = par("lwd"), box.lty = par("lty"), box.col = par("fg"),
pt.bg = NA, cex = 1, pt.cex = cex, pt.lwd = lwd,
xjust = 0, yjust = 1, x.intersp = 1, y.intersp = 1,
adj = c(0, 0.5), text.width = NULL, text.col = par("col"),
text.font = NULL, merge = do.lines && has.pch, trace = FALSE,
plot = TRUE, ncol = 1, horiz = FALSE, title = NULL,
inset = 0, xpd, title.col = text.col, title.adj = 0.5,
seg.len = 2)
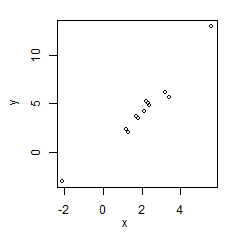
Suppose we have a group of data from some samples, and have a plot:
>x <- c(1.2,3.4,1.3,-2.1,5.6,2.3,3.2,2.4,2.1,1.8,1.7,2.2)
>y <- c(2.4,5.7,2.0,-3,13,5,6.2,4.8,4.2,3.5,3.7,5.2)
>plot(x,y,cex=.8,pch=1,xlab="x",ylab="y",col="black")
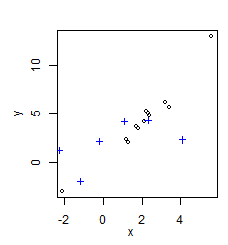
Let's add another a group of control data to the plot:
>x2 <- c(4.1,1.1,-2.3,-0.2,-1.2,2.3)
>y2 <- c(2.3,4.2,1.2,2.1,-2,4.3)
>points(x2,y2,cex=.8,pch=3,col="blue")
Then we add a legend to the plot:
>legend(x=-2,y=12,c("sample","control"),cex=.8,
col=c("black","blue"),pch=c(1,3))

 See Scatter Plot for how to produce a legend beside the main plot.

