R Draw Circle


draw.circle(...) function draws a circle on the plot. It's usage is:

draw.circle(x,y,radius,nv=100,border=NULL,col=NA,lty=1,lwd=1)


x,y: Circle center coordinates
radius: Circle radius
nv: Number of vertices
border: Border Color
col: Fill Color
lty: Line type
lwd: Line width

draw.circle requires "plotrix" package, to install:

>install.packages("plotrix")


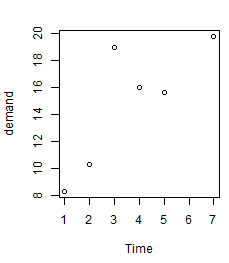
Let's first plot the BOD data frame:

>plot(BOD)


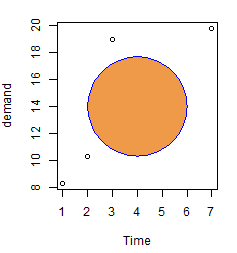
Add a circle to the plot:

>require(plotrix)
>draw.circle(4,14,2,border="blue",col="tan2")

endmemo.com © 2024  | Terms of Use | Privacy | Home